Market Timing
Hopefully buy low, hopefully sell higher, repeat
VS
Buy and hold strategy
"Nobody but nobody, has consistently guessed the direction of the bond or stock market over any meaningful length of time." - John Markese, President, American Association of Individual Investors Journal
"There is an overwhelming body of evidence to support the view that believing in the ability of market timers is the equivalent of believing astrologers can predict the future." - Larry Swedroe, Author
"I don’t believe in market timing. I’ve been around this business darn near a half-century, and I know I can’t do it successfully. In fact, I don’t even know anyone who knows anyone who has ever successfully timed the market over the long term." - John Bogle, Founder of The Vanguard Group
"Only liars manage to always be ‘out’ during bad times and ‘in’ during good times." - Bernard Baruch, Presidential Economic Advisor
 Market timing is the strategy of making buy and/or sell decisions of financial assets (often stocks) by attempting to predict future price movements.
When you invest, if you employ a simple buy and hold strategy then history says that over time your money will grow. From 1928 - 2013 stocks provided an average annual return on investment of 9.6% while 10-year treasuries provided a ROI of 5%. But what if you could make even more money by selling at high points and then buying back in at a lower prices? This strategy sounds simple enough but it isn't. What complicates matters is that timing the market requires not just guessing the right exit point (sell), but the right re entry point (buy back in). The whole time you are betting against the market. This is risky because if the market goes up after you sell, then you miss out on gains. Furthermore if you are employing a so-called stop-loss strategy whereby you sell after the market drops by a certain percentage (such as 7% off it's high), if the market then proceeds to rebound back up, then you have simply locked in a loss! Because the market generally goes up over time (not down), any time you get out of the market you are simply more likely to miss out on gains. In fact some of the biggest stock market gains have occurred in one day, often in a reflex action after the market has dropped.
Timing the market goes against the efficient market hypothesis which essentially states that at any given time prices already reflect all information about securities and the markets.
Experts like Warren Buffett, Peter Lynch, John Bogle, Jason Zweig, Burton G. Malkiel, Charles Ellis and Bernard Baruch don't believe in market timing. They will tell you that you are more likely to get it wrong than right. In other words you are more likely to miss out on gains by being out of the market.
The average investor has failed in attempting to time the market. From 1992 to 2012 the average equity mutual fund investor held mutual funds for just over 3 years and this resulted in an average annual return of just 3.49 percent. Whereas the buy and hold investor had returns of 7.968%.
What about the pros? According the Mark Hulbert, who studied the track records of 103 market timers over a 10 year period, 80 percent of these market timing professionals failed over any reasonable period of time. And Hulbert's survey period included the unusual bear market of the 2000's. Market timers do better during bear markets because typically they are betting against the market by getting out at select times. Take out the bear markets and you would probably expect the failure rate of market timers to be even more than 80%.
For anyone who thinks that the length and gains of a bull market is a predictor of a bear market, according to Mark Hulbert, there is no statistically significant correlation between a bull market’s length or gain and the subsequent bear market’s length or loss.
If you do a lot of market timing you may find yourself paying short-term (higher) taxes when selling securities that you've held for less than a year. And any time you pay taxes sooner than later you are forking over money that doesn't get a chance to further grow and compound. This makes the challenge of timing the market even more of an uphill battle.
And by attempting to time the market you of course also increase trading costs.
NOTE: Do not confuse market timing with rebalancing as part of a long-term allocation strategy. Long-term strategy will vary depending on various factors such as age, appetite for risk, goals, etc. An allocation strategy strategy might change depending on long-term trends. For example super low interest rates have caused many advisers to recommend a little more exposure to stocks rather than bonds for conservative investors in order to meet retirement goals.
Are Market Timing Services Worth it?
Some advisers are selling market timing services and/or they adopt a market timing strategy as part of their asset management services. One such service has been boldly stating in paid radio advertisements that "It's critical to have a sell strategy". REALLY??? SINCE WHEN?
For starters Vanguard does not list market timing as something that an adviser does!
Respected experts such as John Bogle preach the time tested method of buy / hold / rebalance and they warn against attempts to time the market saying that over time you are more likely to get it wrong. One common market timing strategy is called stop-loss in which you sell if and when the market drops by a certain percentage off its recent high. But if you employ a stop loss strategy you miss out on gains if the market stops dropping and continues upward. During long bull markets this stop-loss strategy can really backfire.
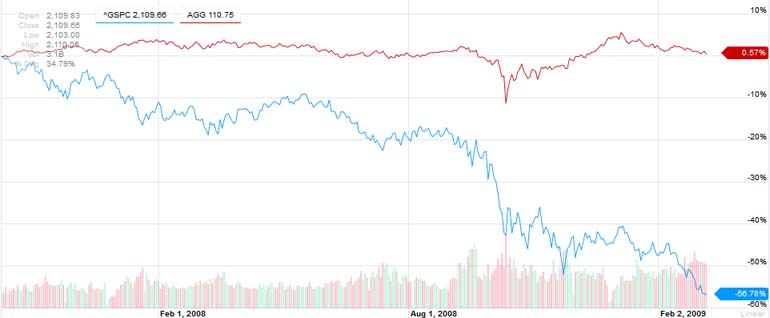
Furthermore, if you are sensibly diversified into stocks and bonds you don't have to do anything. That's the purpose of owning bonds. They smooth out stock volatility. As the saying goes, when stocks fall money runs to the safety of bonds. And then if the market crashes you have the opportunity to rebalance. In the chart below (2007 - 2009 market crash) you can see that while the S&P 500 index dropped 56.7% (from peak to bottom) the total bond market index ETF AGG actually gained 0.57%. According to Vanguard a simple rebalancing strategy can add up to 0.35% per year in increased returns.
TRYING TO QUANTIFY THE VALUE (OR LACK OF VALUE) OF A MARKET TIMING SERVICE
There is a market timing asset manager who frequently advertises on radio. It appears as if this asset manager employs a form of stop-loss strategy. On his paid radio commercials, which have the appearance of being part of the regular programming but isn't, his main selling point is that clients who followed his advice "did not lose money in the stock market crash of 2008".
Let's start by analyzing this market timing call.
During this stock market crash of 2007 - 2009, from highest peak to lowest bottom, the S&P 500 total return index (which accounts for dividends) lost 55.25%. Market timing requires an exit point and a re entry point. This adviser did not pick the exact peak or the exact bottom. Doing so is virtually impossible. The very nature of stop-loss involves selling after the market has already declined and then not buying back until the market has already made a rebound. This asset manager signaled to get out from November 27, 2007 until June 12, 2009. I am assuming that these sell and buy signals were made before the opening of trading. That would mean an exit from the market at $1,409.59 and a reentry at $943.44. That would mean that his clients actually only averted stock loses of 33.07%. And since his investors were out of the market they earned no stock dividends. It is unclear if he called for clients to move their money to bonds or not. I will have to assume that this money sat in cash, in which case his clients missed out on 1 1/2 years worth of dividends or roughly 4%. That means that in reality his clients only averted loses of about 29.07%. Still a sizeable savings, but nowhere near the entire 56.70% peak to bottom S&P 500 index loss.
Also, for purposes of this analysis, we are assuming that investors were 100% invested in stocks. This might be appropriate for some investors such as 20 year olds, but certainly not for most investors. Senior citizens are more likely to be only invested about 33% in stocks if they are sensibly diversified. In this case, whatever value this market timing service has is diminished by 66%.
One thing that works in favor of this market timer is the "break even fallacy". In order to make up for loses, buy and hold investors need to makeup for not 29.07% but 40.98%. So for anyone who was heavily invested in stocks and implemented a stop loss strategy like that of this adviser, they made out like bandits! I should point out that by selling, these market timing investors realized capital gains taxes which further reduced long term performance, but I don't think anyone was complaining.
But as the saying goes, past performance is no guarantee of future results, and long-term performance is the true test. Sometimes stop-loss strategies backfire. This adviser openly discloses that his market timing system is not perfect. In fact since 2009 this adviser has incorrectly jumped the gun twice, certainly much to the chagrin of new clients who have forever missed out on gains.
His exit plan in 2010 was wrong and this caused investors who followed his advice to miss out on 4.56% in S&P 500 index gains (not counting lost dividends). It's important to note that this 4.56% represents money that moving forward could have been compounding each and every year but isn't. As of just 2/23/2015 that 4.56% would have compounded to more than 8.72% (and that's not even including compounding dividends produced by that 8.72%) because the stock market has since gone up 91.26% (not including dividends). This stop-loss strategy also cost you trading fees and as always you had to pay capital gains taxes instead of allowing all of that money to grow and compound.
And again in 2011 his exit plan was wrong. He got his clients out on August 5, 2011 and then back in on January 19, 2012. This simply resulted in missing out on 9.56% in S&P 500 gains. Since then the S&P 500 price return index (again not including dividends) has gone up 76.52% which means that in reality you have missed out on more than 16.87% in gains.
Apparently this guy also charges 1% in annual fees for his asset management / market timing service. So after just 5 years that's another 5.1% in muted portfolio returns when compounded.
This means that if you put your money under this guy's management in 2010 you have so far missed out on at least 30.69% in gains. And that's not even including reinvested and compounding dividends, the extra trading costs and the effects of paying taxes with money that can no longer work for you and compound. Additionally, word on the web is that this guy may require that his investors put their money into funds that are more expensive than index funds, although I cannot be sure of this.
So for anyone who signed up for this service after 2009, just to get back to even and make up for the 2010 and 2011 mistakes and 1% asset management fees they need perhaps about a 40% stock market crash, which doesn't happen very often! This takes into consideration the break even fallacy and the assumption that he will get in and out in similar fashion as he did from 2008 - 2010. There is no guarantee that he will. Timing the market on a consistent basis is an uphill battle with an 80% failure rate according to Mark Hulbert. This cannot be emphasized enough. John Bogle says that he doesn't know anyone who has done this over the long-term. And in the case of this market timing asset manager, John Bogle is once again correct. New clients who signed on with this market timing asset manager have dug themselves into a hole. This apparently still hasn't stopped new investors from coming aboard. As of 2013 this market timing "guru" had 1.8 billion dollars under management.
As a footnote, I cannot find any information on about this adviser's market timing calls before 2007. This is critical. Is he cherry picking time periods? I don't know. Did he miss any other calls like he did in in 2010 and 2011? If he made good market timing calls I think he certainly would have mentioned this, although it is unclear how long he has been implementing this market timing strategy.
CONCLUSION: Again, the experts do not believe in market timing. But there will always be investors who choose to go against the grain. Investors should know that there is nothing new about stop-loss and other market timing strategies. You can implement a strategy of your own. It isn't rocket science. If you want to summon the help of a guru, there are market timing newsletters (such as radio host Bob Brinker's newsletter) that at least won't break the bank as much as an "asset manager" who charges 1% per year. This website already specifically makes an argument for why you should avoid asset managers of all shapes and sizes (not just the market timing variety).
Doom & gloom headlines = Normal
It's one thing to pay someone to attempt to time the market. But what about doing it on your own, perhaps by reacting to headlines? Probably not a good idea. Legendary fund manager Peter Lynch has said that there is always something to worry about. We are constantly being bombarded with doom and gloom headlines that suggest troubled times ahead for investors. Every year there is something to worry about. If you were to act on these headlines you are more likely to miss the train than to avert disaster. Despite all of the major and minor calamities, stocks have been twice as rewarding as owning bonds. Instead, focus on the long-term buy and hold picture. All you can do is diversify and remain diversified by rebalancing as needed.
Remember that the way to sell something (such as literature or alternative investments) or to generate more web traffic is to scare people. It is human nature to be protective (survival instinct) and thus we are fearful and drawn to doom and gloom articles.
6 years of constant doom & gloom headlines
Keep in mind that the stock market drops 10% or more on average every 11 months. So anyone can call for a stock market "correction" to happen with a vague time horizon. Many of these predictions are conveniently not really time specific. History says that there's a 50% chance that a 10% correction will occur within 5 1/2 months of any prediction.
Headline has been continually republished since as early as Sept 16, 2012, predicting a stock market crash worse than 2008 - 2009: "Billionaires Dumping Stocks, Economist Knows Why"
NOTE: This so-called "news story" is actually an advertisement aimed at selling alarmist literature.
Result: No market crash. S&P 500 index dropped as low as 7.23% but has since gone up about 46% including dividends over the last 2 years and 3 months.
Headline published on Oct 10, 2014:
"Investor who predicted the subprime crisis says stocks will fall 10%-plus"
Result: S&P 500 index only dropped as low as -3.28% (5 days later).
By Dec. 29, 2014 the S&P 500 index was up +9.68% above its Oct 10 level.
A year later stocks were up 8% including dividends.
Headline published on Dec 2, 2014: "Stock-Market Correction Eminent" [a "correction" is A DECLINE OF 10% OR MORE]
Result: S&P 500 index only went down 4.5% then up 2% by Feb 20, 2015.
Headline published on Dec 12, 2014:
"CIA Insider Warns: "25-Year Great Depression is About to Strike America"
"You will want to remember this date [constantly changing date]"
NOTE: This so-called "news story" is actually an advertisement aimed at selling alarmist literature.
Result: Of course none of their ever changing predictions have come true.
Multiple headlines published on Jan 15, 2015:
"Wall St. braces for shock waves from Swiss move"
"What it looks like when the Swiss rock global markets"
"How currency wars could hit stock market"
"Biggest drop for Swiss stocks since 1989"
"Wall street starts forth quarter earnings season under cloud of worry"
Result: The S&P 500 index only dropped as low as 0.92% (that day). 7 days later the S&P index had bounced back 2.27% above its Jan 15 level. By Feb 17th it had gained 5.57%, a very healthy one month gain.
Headline published Jan 30, 2015: "Stocks are flashing a major sell signal"
Result: For 6 1/2 months this never happened. Finally, on August 25, 2015, stock briefly dropped as low as about 6% below this Jan 30th price level. But, this doesn't even qualify as a "correction". a "correction" is A DECLINE OF 10% OR MORE.
Headline published Feb 19, 2015: "A Stock Market Alarm Is Sounding for the First Time Since 2007"
Result: Stocks basically went sideways for 6 months. Stocks then dropped as low as 12% below this Feb 19th price level. Again, this prediction is about par for the course on a 50/50 bet.
Headline published Feb 23, 2015: "10 reasons U.S. stocks may see a 10%-20% correction by July"
Result: All 10 reasons were wrong. The big crash never happened. By July 1st the S&P was only 1.8% lower.
Headline published Feb 25, 2015: "Stock Market Crash of 2016: The countdown begins"
NOTE: This article predicts a crash of 50% sometime in 2016.
Result: The ole' 50% crash never happened.
Headline published March 25, 2015: "Stocks are overvalued and headed for trouble: analyst"
Result: 3 months later stocks have still not crashed.
Headline published March 31, 2015: "Best time to sell stocks and go away starts tomorrow"
NOTE: This article suggests that stocks might be flat or under perform until October 31st according to the "Sell in May, Go away" seasonal pattern.
Result: Over the next 3 1/2 months stocks briefly fell less than 1% but have averaged about 2% higher.
Headline published April 6,2015: "6 reasons to sell stocks now and go to cash"
Result: More than 4 months later stocks dipped about 12%.
Video broadcast on 5/1/2015: "I think there's a good probability of a June swoon in the markets"
Result: Never happened. Stocks traded in a sideways pattern through June ending down only 1.4% on June 30th.
Headline published 5/8/2015: "Don't buy into this jobs-fueled rally, market timer warns"
Result: More than 3 months later stocks had dropped as much as 12%.
Headline published 5/11/2015: "Silver could see a 40% spike by year end"
Price of silver was $16.235 when this article was published.
Result: By July silver had gone down to $14.49. By year end Silver was down to $13.825 for a 15% loss, and this prediction missed the mark by 40%. 1 1/2 years later silver was still floundering at $16.00.
Headline published 5/13/2015: "Are you ready for a 20%-50% decline?"
Result: 3 months later stocks did drop as much as 13%. If you were psychic then you bought back in on 2/11/2016. If you waited for that 13% loss to drop to 20% then you missed out on a 19.7% spike upward.
Headline published 5/17/2015: "An important Dow divergence is ominous for stocks"
Result: Fail.
Headline published 5/18/2015: "A 'scary summer' is ahead for stocks: [says] Bank of America"
Result: Stocks dropped as low as 12.5% on 8/25/2016.
Headline published 5/25/2015: "It's time to dispel the myth of the summer rally in stocks"
Result: By late August stocks lost as much as 12.2% before quickly recovering 6.5% of that drop in only 2 trading days. You would have to be psychic to pick the bottom. Corrections of 10% or more happen every 11 months on average, just as a broken clock is right twice a day.
Headline published 5/29/2015: "Fuel and potential fires for the US economy ahead"
Result: Nearly 3 months later we had our brief little correction of about 10%. Corrections of 10% or more happen every 11 months on average, just as a broken clock is right twice a day.
Headline published 6/9/2015: "The S&P 500 is approaching the zone of death"
Result: S&P was briefly down 9% on 8/25/2015. S&P briefly hit nearly 11% below the 6/9/2015 level on Feb 11, 2016. The stock market corrects 10% or more about every 11 months on average.
Headline published 6/12/2015: "The signs that say a stock market correction is close. We expect the market moving into an important early summer top followed by a 15% to 20% correction into Q3 before starting another tactical bull cycle "
Result: More than 2 months later (in late Summer) the S&P dropped about 11%. Bull cycle did not resume until Feb 11, 2016.
Headline published 6/25/2015: "Carl Icahn warns market is extremely overheated"
Result: Carl Icahn has been calling for a cash in bonds and stocks for ages! Still hasn't happened.
Headline published 7/18/2015: "Doubling down on a summer correction"
Result: S&P dropped as much as 12.2% by the end of summer.
Headline published 7/18/2015: "Market timer Tom McClellan sees stocks set up for ugly decline [between Aug. 20 and Aug. 26]. He predicts an "ugly decline” lasting into early 2016
Result: For once a prediction turned out to be right, at least if you consider 12% an "ugly decline". Stocks did indeed bottom on Feb 11, 2016.
Headlines published 8/26/2015: "Why the stock market correction isn't over yet" and "Dow's rally looks like a dead cat bounce"
Result: Stocks bounced back, then fell down again but only slightly below the 8/25/2015 low.
Headline published 9/6/2015: "Get ready for a lousy September as investor sentiment slips"
Result: This prediction failed. The S&P finished the month of September even.
Headline published 9/8/2015: "1,700 on the S&P more likely than not"
Result: The S&P only reached as low as 1,829 on 2/11/2016.
Headline published 9/25/2015: "Shiller: Stocks and Housing are Overvalued"
Result: 2 weeks later stocks are up nearly 5%. More than a month later stocks are up 7 1/2%.
Headline published 10/12/2015: "3 Reasons Why Stocks Won't Rally"
Result: Stocks rallied about 4%, then bottomed 11% below the 10/12 level.
Published 10/12/2015: "Cramer: We're in a danger zone. Sideline your cash"
Result: Stocks rallied 4% then dropped about 9% below the 10/12/2015 level. You would need to have been psychic to call this bottom.
Published 12/22/2015: "This smart money indicator nailed the dot-com bust, and it's even more bearish now"
Result: No dot-com-like bust. Stocks only briefly dropped 9% from the 12/22/2015 level, and has since rallied more than 6% higher than the 12/22/2016 level. The stock market corrects 10% or more about every 11 months on average.
Published 1/11/2016: "Bearish JP Morgan says sell stocks on any rally"
Result: Terrible advice. If you were psychic enough to sell the very next day then you would have essentially missed out on a 10% rally through August of 2016.
Published 7/30/2016: "Presidential Election Cycle Indicates a Market Pull-Back in the Fall" - Pullback in September lasting into mid-October."
Result: Stocks dropped only 2.15%. This trade wasn't worth paying capital gains taxes.
Published 8/1/2016: "Goldman Sachs says stay away from stocks for the next three months"
Result: Stocks dropped only 2.6%. This trade wasn't worth paying capital gains taxes.
Published 8/30/2016: "Get ready for a 5 - 10% stock market drop"
Result: S&P dropped as much as 4.5% by 11/4/2016, then spiked upward. Even if you were psychic enough to buy back in on 11/4 then this trade still wasn't worth paying capital gains taxes.
Published 9/7/2016: "U.S. stocks are in danger of rolling over"
Result: 3 months later the market is up 3.4%.
Published 9/13/2016: "The pattern that signals a potential 25% plunge for the S&P 500 by Spring"
Result: Wrong. As of Dec 9th the S&P has since gone up 6.2%.
Published 9/21/2016 - "We believe we are in the midst of the market correction we have been expecting. It will likely persist over the next 3-4 months and be the largest correction since the 2008 crisis."
Result: Wrong. Market is up 4.5% as of December 9th. So much for a persisting correction.
Published 10/10/2016 - "S&P 500’s ‘triangle’ chart pattern warns of a big sell-off, analyst says"
Result: Wrong. 2 months later the S&P was up 4.5% by December 9th.
Published 10/31/2016 - "Know when to fold ’em: The stock market just gave us 3 ominous tells"
Result: Wrong. S&P was up 6.8% by December 13th.
Published 9/7/2016 - "Mark Cuban preparing for a crash: If Donald Trump wins, there is no doubt in my mind the market tanks"
Published 10/2/2016 - "Trump win could cause an 11 to 13 percent sell-off in the S&P 500, says Barclays"
Published 10/6/2016 - "S&P 500 is expected to fall 7% on a Trump presidency"
Result: The gurus and "experts" were all completely wrong and probably let their political affiliations get in the way of their investing sentiment. Stocks only went up. From Nov 8 to Nov 25 stocks went up 6.15%. By June 2, 2017 stocks were up 17%. By early January 2018 stocks were up about 35%.
Published 10/24/2016 - "A Trump win would sink stocks."
Result: Fake news CNN predicted a 10 - 15% stock nosedive if Trump won. The complete oppose occurred.
Published 11/13/2016 - "Trump rally to be followed by 11% stock-market tumble. Dow could first hit 19,000 in next few sessions—but then fall, technician says"
Result: Completely wrong. Just a month and one week later the DOW was up to 19,974.
Published 1/11/2017 - "Beware of the ‘Trump dump’ in stocks as rally peters out"
Result: Wrong. From 1/11 to 3/1 stocks went up 5.3%.
Published 1/30/2017 - "4 signs a stock-market sell-off in February may be in the cards"
Result: Wrong. Stocks went up 3.6% in February.
Published 3/3/2017 - "This chart says a sell-off is looming as fear stalks the stock market rally"
Result: 4 months later stocks had drifted as low as 2.28% before going up gaining 3.19% by 7/17 from the 3/3/ level, so this prediction failed.
Published 3/4/2017 - "Stop! This is NOT like the dot-com bubble... it’s much worse, according to this chart"
Result: 4 1/2 months later stocks are up about 3 1/2%.
Published 3/14/2017 - "This is the most overvalued stock market on record — even worse than 1929"
Result: 4 months later stocks are up 4%.
Published 5/16/2017 - "Goldman Sachs says stock market rally may hit the brakes"
Result: 2 months later stocks are up more than 3%.
Published 5/28/2017 - "Why one hedge-fund titan is bracing for ‘all hell to break loose’ in the stock market"
Result: Still waiting....
Published 6/8/2017 - "Bill Gross warns U.S. market risk is at highest since 2008 crisis"
Result: 7 months later stocks are up about 14%.
Published 7/17/2017 - "U.S. stock market will likely top out in the next three weeks"
Result: This prediction flopped. Stocks indeed 'topped out in 3 weeks' but only dropped 2.3% before resuming the bull market run.
Published 8/18/2017 - "7 signs the stock market is ready to run smack into a wall"
Result: DOW was at 21,674 when this article hit. The DOW proceeded to go up another 23% hitting 26,652 on 1/28/2018. Even after the DOW dipped to 23,589 you had missed out on 8.8% in gains.
Published 8/21/2017 - "Ron Paul: Stocks may get chopped in half within a year, but it won’t be Trump’s fault"
Result: The DOW was at 21,891 when this article was published. For stocks to get chopped in half would take us close to levels seen in 1999. A regression to levels seen in 1999 is simply not going to happen.
Published 8/23/2017 - "HSBC Holdings Plc, Citigroup Inc. and Morgan Stanley see mounting evidence that global markets are in the last stage of their rallies before a downturn in the business cycle."
Result: Wrong. A year later we're still waiting for this downturn.
Published 11/22/2017 - "Bank of America sees end of bull market coming in 2018"
Result: The bull market did not end in 2018. In fact as of 11/19/2019 the bull market continues.
Published 11/27/2017 - "Smart money is planning for the end of this bull market: NYSE trader"
Result: On 11/27/2018 the DOW was at 23,801. The "smart money" ultimately missed out on 12% in gains when the DOW hit 26,652. The DOW later dipped to 23,589 for a 1% loss, but nobody picks the exact bottom. This market timing effort caused a loss and prematurely paid capital gains taxes.
Published 11/30/2017 - "Goldman says highest valuations since 1900 leave investors in for a world of hurt"
Result: The DOW closed at 24,224 on 11/30/2017. But the DOW went up to 26,652 for a 10% gain. The DOW later dipped to 23,589 for a 2.7% loss. Nobody ever picks the exact bottom so this market timing effort was for nothing but prematurely paying capital gains taxes. Sorry Goldman.
Published 1/3/2018 - "Stock investors should brace for a possible near-term melt-up: Jeremy Grantham"
Result: The DOW closed at 25,073 on 1/3/2018. From here the DOW went up to 26,652 for a gain of 6.3%. The DOW later hit as low as 23,589 for a drop of 6%. Not exactly a "melt-up".
Published 1/11/2018 - "The man who called a new bull market in 2012 says take your profits now. Piper Jaffray’s Craig Johnson thinks the stock market could correct by 20%"
Result: After this article hit, the DOW closed at 25,806. From here the DOW went up another 4% to 26,652 before hitting as low as 23,589, a drop of 8.6%. So much for a 20% drop.
Published 1/12/2018 - "This warning from the High Yield Bonds A-D Line fits well with my expectation of a significant stock market top due in March 2018."
Result: Stocks tanked but starting in early February. Anyone who was waiting to lock in the most gains was hung out to dry.
Published 1/24/2018 = "investors may see ‘the largest bear market in bonds’ since 1980-81". Not sure what "bear market" they are talking about. 10 year treasuries only lost 2.99% in 1980 and gained 8.2% in 1981. Bonds have already been in a bear market since September 2012. Bear markets can't go on forever. The value of BND on 1/24/2018 was $80.73
Result:
Published 2/8/2018 - "The chart reader who called this stock-market selloff says it’s not over yet" Craig Johnson calls for S&P 500 below 2,400 and Dow Jones Industrial Average around 22,000. Johnson expects the shakeout to last 30, 60, or 90 days. At that point, said Johnson, stocks would find support and begin their next bullish move back to his year-end target of S&P 2,850.
Result: As of 4/17 the DOW only dipped as low as 23,589. So much for 22,000.
Published 2/11/2018 - "History suggests the correction isn’t near over, as this chart demonstrates"
Result: This prediction flopped. The S&P traded mostly much higher in the coming months, only touching 1.46% lower on 4/2/2018.
Predicted 2/6/2018 - "Dow could plummet to 14,000 by [late] April, economic forecaster [Harry Dent] warns" DOW was at 24,912.77 on 2/6/2019.
Result: The DOW went lower than the 2/4/2018 low, which would appear to be the crossing of the ominous "trend line" that Dent spoke of. However ultimately the DOW never closed lower than 23,553.
Published 2/14/2018 - "70% of fund managers see danger ahead—the highest percentage since the financial crisis" "no all clear to buy the dip yet, strategist says"
Result: The S&P went on to drop 4.3% by 4/2/2018 before moving upward.
Published 2/20/2018 - "Technical charts suggest another stock-market drop is coming. S&P 500 likely will see a retest of the prior lows"
S&P was at 2,733.81 when this article was published.
Result: So much for the big "test". On 3/23/2018 the S&P closed within 7 points of its 2/8/2018 low, then resumed the bull market run.
Published 3/24/2018 - "Tom McClellan: We’re in a Bear Market"
S&P 500 was at 2,588.26 when this article was published.
Result: Wrong. The lowest day for the S&P was already behind us.
Published 3/27/2018 - "Stocks may already be in a bear market — and here’s how long it could last"
Article suggests that the DOW could face another 11 months of a decline, dropping 5,529 points to 18,328.
Result: Wrong. Over the next 5 months the S&P went up about 12% to 2,899. The DOW was at 26,151 on 8/28/2018.
Published 7/9/2018 - "Opinion: Technical charts point to S&P 2,800 — and then a pullback"
Result: Wrong. The S&P hit 2,930.75 on 9/20/2018.
Published 7/19/2018 - "70% Stock Market Crash to Strike August 1, Economist Warns"
HINT: They're selling a $47 newsletter. And they keep moving the dates. Now it's September 1, which isn't even a trading day, so obviously these people are just moving the goal posts at will.
Result:
Published 9/1/2018 - "The last time Wall Street’s fear index and stocks traded this closely it didn’t end well"
Result: Article suggests a 10% correction. For once a prediction turned out to be right.
Published 10/13/2018 - "The stock market’s nightmare may be far from over"
Result: Article states that the awful start to the quarter does not bode well for remainder of the year.
Published 10/29/2018 - "Monday’s nasty reversal is evidence that the worst is far from over for Wall Street"
Result: Wrong. Dow up 7.1% in 7 trading days.
Published 10/30/2018 - "Jim Cramer: This market is reminiscent of the worst crashes I’ve ever seen"
Result: Wrong. Dow up 5.25% in 6 trading days.
Published 10/8/2018 - "It is time to sell... finally"
Result: Finally a prediction that was on to something. On 10/29 the S&P closed 8.4% lower than the time of the sell signal. Of course nobody ever picks the exact bottom to get back in.
Published 11/12/2018 - "CNBC's Jim Cramer says stock market is in a very serious correction and there's nowhere to hide"
Result:
Published 11/12/2018 - "Trap door under the market could slash S&P by two-thirds, warns fund manager"
Result: Fail! A year later the S&P total return index is up close to 16.5%.
Published 11/13/2018 - "Small-cap index perilously close to death cross — and that’s bad news for broader market"
Result:
Published 11/14/2018 - "Billionaire investor Steve Cohen sees a bear market heading our way"... "at some point we’re going to enter a bear market, and it’s going to happen in the next year and a half, maybe two"
Result:
Broadcast 11/15/2018 on Coast to Coast AM w/ George Noory - Andre Eggelletion: "[what we saw on Monday, Tuesday and again today I think signals that] it’s time for a correction"
Result:
Published 11/17/2018 - "Hedge-fund boss who predicted ‘87 crash says get ready for some really scary moments". Paul Tudor Jones believes that bonds and stocks are overvalued.
Result:
Published 11/20/2018 - "Goldman Says It's Time for Equity Investors to Boost Their Cash"
Result:
Published 11/27/2018 - "Jim Cramer says stocks are opening up huge on nothing, sees signs of ‘classic bear market"
Result:
Published 11/27/2018 - "Opinion: It’s time to sell into rallies, bear market or not. We may see a rebound, but the risk is rising as the bull market ages"
Result:
Published 11/29/2018 - "The most reliable recession indicator has been deteriorating"
Result:
Published 12/6/2018 - "A looming death cross for the S&P 500 highlights a stock market in tatters"
Result:
Drudge Report Headline 12/6/2018 - "BLOOD ON STREET DOW LOSES 1,000 IN TWO DAYS"
Drudge Report Headline 12/10/2018 - "Stock market's severe drop could be ominous sign"
Published 12/10/2018 - "Stocks threaten ‘cliff’s edge’ as S&P 500 dips below 2,616: chart watcher"
Published 12/10/2018 - "The next worry for U.S. stocks: shrinking profit forecasts"
Published 12/10/2018 - "Hedge-fund boss Paul Tudor Jones says stocks could fall 15% before rebound"
Result: Wrong. Stocks only dropped another 10.86%. Anyoe who was waiting around for the 15% level to be breached, watched a huge rebound from the sidellines.
Published 12/13/2018 - "Opinion: Here’s more evidence that stocks are now facing a bear market." Note that bear market territory would be reached when stocks drop 20% or more.
Result: If you include intraday highs then yes we barely reached 'bear market' territory.
Published 12/14/2018 - "Opinion: Stock investors, you have now been warned for the last time. There are six warning signs that the bull market in U.S. stocks will soon be over"
Result:
Published 12/15/2018 - "Here’s why the Fed won’t save the stock market, despite its worst December start since 1980"
Published 12/17/2018 - "Ron Paul: A 50% correction will spark depression-like conditions that may be worse than 1929"
Published 12/17/2018 - "Major hedge funds are scrambling to prevent financial wipeout"
Published 12/17/2018 - "The last, and perhaps biggest, death cross is poised to engulf the stock market"
Published 12/17/2018 - "The S&P 500’s lower low warns that the worst is yet to come"
Published 12/17/2018 - "Stocks still not showing the ‘panic’ selling that’s associated with market bottoms"
Result: Stocks did indeed drop another 7.65% before hitting bottom. Not sure if this is the type of panic that was envisioned.
Published 12/18/2018 - "The smart money is the most bearish on stocks since 2008, with recession coming: B of A survey finds. 53% of institutional investors surveyed see global economy deteriorating over next 12 months"
Published 12/18/2018 - "Druckenmiller warns that the stock market is one big ‘mirage’ right now." "Druckenmiller said the U.S. could be looking at a 2007-type situation" "there’s something not right [inside the stock market]"
Published 12/19/2018 - "Peter Schiff says we’re not in a bear market, we’re in a house of cards that the Fed built." "I’m watching the U.S. economy implode from the beach. We’re in a lot of trouble."
Published 12/20/2018 - "One of Wall Street’s most successful investors says a Fed stock-market lifeline is gone"
Published 12/21/2018 - "World’s biggest hedge fund says stocks aren’t pricing in ‘near-recession’ U.S. growth next year"
Published 12/25/2018 - "We are now in a bear market — here's what that means. Since World War II, bear markets have lasted 13 months on average, and stock markets tend to lose 30.4 percent of their value. During those conditions it usually takes stocks an average 22 months to recover, according to analysis from Goldman Sachs and CNBC."
Published 12/26/2018 - "Economic growth slowing around the world"
Published 12/26/2018 - "Clinton Treasury Secretary ups chances of recession before 2020 [to 60%]"
Published 12/26/2018 - "The Markets Are Signaling Something Awful Ahead"
Result: Wrong. By 3/21/2019 stocks were up 20.8%.
Published 12/27/2018 - "Why stock-market investors fear historic rebound was just a wicked bear trap"
Result: Wrong. 3 months later stocks are up 15.2%.
Published 12/27/2018 - "U.S. Stocks Tumble Amid Renewed US -China Tensions"
Published 12/27/2018 - "Charts show stock market may still be months away from finding a floor"
Published 1/2/2019 - "Apple's warning a bad omen for Wall Street bulls"
Published 1/3/2019 - "If this is a ‘proper’ bear market, stocks ‘are only at the beginning of the selloff’: SocGen"
Published 1/3/2019 - "Jim Cramer: Everything Is Going Wrong, Just Like People Said About 2019"
Result: Wrong. Everything went right. By 3/21/2019 stocks were up 16.6%
Published 1/10/2019 - "Worst may not be over for stock market, technical analysts say" "Markets were oversold before Christmas, now they look overbought"
Published 1/10/2019 - "The stock market is too damaged for a sustained rally, strategist warns"
Result: Wrong. Stocks up 11.4% in less than 3 months.
Published 1/15/2019 - "Investors haven’t been this bearish about global profits since the financial crisis, say BAML survey"
Published 1/28/2019 - "It’s time to ‘dismount’ from this stock-market rodeo, says Morgan Stanley’s Wilson"
Published 2/2/2019 - "The evidence is in: Stocks are in a bull trap. The stock market today mirrors the years 2000 and 2007, when prices peaked"
Published 2/11/2019 - "Stock market may be in for a rude awakening as profits dry up, warns strategist"
Published 2/11/2019 - "U.S. stock market is set to fall this week, according to Elliott Wave theory" Comments were disabled under this article, suggesting that this author has been facing a backlash of negative comments over his predictions.
Result: Fail! Stocks went up 2.4% for the week. Nearly 2 months later stocks were up 5.8%.
Published 2/14/2019 - "Dow skids after ‘dreadful’ retail-sales report sparks recession fears"
Published 2/19/2019 - "A drop in U.S. stocks may be fast and furious, according to Elliott Wave theory" S&P was at 2,779.76 when this article was published. As always the author disabled comments under his article.
Result: Fail! 10 months later and we're still waiting for the fast and furious drop.
Published 2/22/2019 - "‘Father of Reaganomics says get out of the market — bond and stock market — and put your money in cash"
Result: Bad advice. S&P price return index has slowly edged up 7.3% nearly 10 months later.
Published 3/18/2019 - "Stocks are poised for an 18% hit, warns economist who nailed last financial crisis"
Result: Fail! 9 months later and we're still waiting.
Published 3/22/2019 - "The bond market is flashing its biggest recession sign since before the financial crisis"
Result:
Published 4/17/2019 - "Two-thirds of American CFOs predict a recession by the summer of 2020"
Result:
Published 4/30/2019 - "Expect a ‘minor correction’ of 5% before stocks march higher, famed bull says"
Result: Stocks indeed dropped about 6.5% over the next month before moving higher.
Published 6/3/2019 - "One of Wall St.’s premier investors says S&P 500 may tumble 16% by summer’s end because markets never had a trade war like this"
Result: Never happened. In fact stocks immediately went straight up 10%. The S&P finished the summer up 6.35%
Published 6/4/2019 - "Morgan Stanley tells investors to play defense as cycle indicator flashes downturn. A shift to a ‘downturn’ phase has historically led to lower returns in the next 12 months"
Result:
Published 6/16/2019 - "The Fed may break a lot of stock-market investors’ hearts this week"
Result:Wrong. Stocks only went up.
Published 7/11/2019 - "Morgan Stanley’s Shalett: Recession, 10% Dip Likely"
Result: Fail. Stocks traded as low as 5.3% on 8/14, but ultimately finished the year up 7.7%
Published 7/11/2019 - "Strategist warns of a ‘huge recipe for a really sharp correction’ within 18 months"
Result: A market correction is defined as a decline of 10% or greater. On average, stocks drop 10% or more about every 11 months, so this prediction is useless.
Published 8/6/2019 - "Is a recession coming? Yield curve signals loudest warning since 2007"
Result:
Published 8/6/2019 - "Brace for a 2nd wave of stock-market volatility [in late August or early September] that could be ‘Lehman-like’, says Nomura"
Result: Terrible time to be OUT of the stock market! The DOW went up 6.68% from mid-August to mid-September.
Published 8/6/2019 - "Trump’s war on the Fed could shatter the stock market"
Result: Fail. S&P went up 12.11% for the remainder of the year.
Published 8/13/2019 - "Main yield curve nearly inverts" "Yield curve inversions predicted 7 out of 9 recessions during the post-war period. This is a track record any economist would be proud of”
Result:
Published 8/19/2019 - "Stocks could fall another 8% as ‘Trump put’ and ‘Fed put’ expire, says Morgan Stanley’s Mike Wilson"
Result: Wrong. Stocks traded as low as 2.6% lower (on 8/23) and as high as 2.9% higher (on 9/12).
Published 8/26/2019 - "A sell-off worse than December can arrive in a week, says analyst who is predicting ‘Lehman-like’ drop" "uncanny resemblance between now and 2008"
Result: Fail! That week stocks spiked up.
Published 8/28/2019 - "New recession warning: The rich aren’t spending"
Result: A broken clock is right sometimes. The coronavirus drop was 20.36% from this date. It had nothing to do with "the rich not spending".
Published 8/30/2019 - "September is the worst month for stocks — and it’s even gloomier after a downbeat August" "S&P on average falls 1% in September"
Result: Wrong. Gloom never happened. S&P price return index ended the month 1.7% higher.
Published 9/18/2019 - "Stocks could drop 20% after an October disappointment, strategist warns"
Result: Wrong. Stocks traded higher on November 1st.
Published 9/21/2019 - "Stock market’s eerie parallels to September 2007 should raise recession fears"
Result: A broken clock is right sometimes. This time, thanks to coronavirus.
Published 9/26/2019 - "The next 5%-10% in the stock market is more likely to be down than higher"
Result: Wrong. The next move over 5% was up. This was achieved within only 2 months.
Published 10/11/2019 - "Expert who called the 2008 crisis says repeat of December [2018] meltdown is inevitable"
Result: Fail! S&P 500 index was up 2.86%.
Published 11/19/2019 - "Opinion: Stocks are likely to slide in coming weeks [until year end] because market-timers are too bullish"
Result: Fail! For the rest of the year stocks never 'slid' even 1%. Stocks went up 3.54% for the remainder of the year.
Published 1/6/2020 - "Stocks could see a double-digit drop in the coming months, warns Wells Fargo"
Result: A broken clock is right sometimes. This time, thanks to coronavirus.
Published 1/9/2020 - "The S&P 500 is now more overvalued than ever, per this measure"
Result: A broken clock is right sometimes. This time, thanks to coronavirus.
Published 1/13/2020 - "As investor optimism nears 2-year highs, analysts warn of stock-market pullback"
Result: A broken clock is right sometimes. This time, thanks to coronavirus.
Published 1/15/2020 - "The last time this ‘clear danger sign’ flashed in the stock market was in 1999, and we all know what happened next"
Result: A broken clock is right sometimes. This time, thanks to coronavirus.
Published 1/15/2020 - "The Stock Market Has Climbed So Far So Fast, Even Some Bulls Are Getting Worried"
Result: A broken clock is right sometimes. This time, thanks to coronavirus.
Published 1/27/2020 - "CNBC’s Jim Cramer: Here comes the panic, but don’t rush to buy the dip"
Result: Fail. Buying this dip provided you with a 4.4% gain over the next 54 days.
Published 1/30/2020 - "Do NOT buy the dip, warns investor who says a ‘brutal bear market’ looms"
Result: Stocks went up 3.1% over the next 51 days.
Published 1/31/2020 - "Godfather of technical analysis says stock-market downturn is going to get worse: I am looking at a 10% drop maybe a little bit more"
Result: Wrong. Market dropped 30.4% from this date, and the drop had everything to do with coronavirus -- not a technical drop.
Published 2/4/2020 - "Stocks headed for a 67% downturn? Seems preposterous now, but it did in 2000 and 2007, too, says fund manager"
Result: 47.6% right / 52.4% wrong. Market only dropped 31.92% from this date.
Published 2/5/2020 - "There’s a 70% chance of recession in the next six months, new study from MIT and State Street finds"
Result: No mention of coronavirus in this prediction. They got lucky.
Published 2/10/2020 - "Longtime bull says he’s sitting on cash ahead of a possible market correction"
Result: Ed Yardeni was right. Sit on cash until there is clarity on coronavirus, but remains bullish long-term.
Published 2/23/2020 - "Why the coronavirus outbreak is delivering a fresh dose of recession fear to the stock market"
Result: Recession fears were founded.
Published 2/25/2020 - "Here are 5 reasons the stock market is tanking, and only one of them is the coronavirus"
Result: The stock market tanked because of coronavirus and the shutdown.
BLACK SWAN EVENT: CORONAVIRUS
Published 3/13/2020 - Why it could take three years for the stock market to reach new heights
Result: Fail! It took less than 6 months for the S&P to recover.
Published 3/18/2020 - It could take 3 years for stock market to recover, says B.C. economist
Result: Fail! It took less than 6 months for the S&P to recover.
Published 4/1/2020 - Co-founder of George Soros’s legendary Quantum Fund warns of the ‘worst bear market of my lifetime’
Result: The S&P only dropped 33.79%, well short of the 56.78% drop of 2007 - 2009.
Published 4/2/2020 - He nailed the March coronavirus selloff — now he says there’s another 30% to go before the stock market hits bottom
Result: Fail! Over the next 4 months the S&P went up 42.81%.
Published 4/13/2020 - Why the stock market is nowhere near a bottom and investors can expect a massive hit
Result: Fail! The stock market continued straight up.
Published 4/27/2020 - ‘Bond King’ warns the stock market could hit new lows amid ‘social unease’
Result: Fail! There was no retest of the lows. The stock market continued straight up.
Published 5/10/2020 - A ‘much more severe’ selloff looms in the stock market, strategist warns
Result: Fail! Never happened. The stock market continued straight up.
Published 6/27/2020 - ‘Black Swan’ author says if investors don’t use a ‘tail hedge,’ he recommends ‘not being in the market’—‘We’re facing a huge amount of uncertainty
Result: This would have been a terrible time to be out of the market because it continued straight up.
Published 7/6/2020 - The latest sign of a stock market bubble: Small companies claiming to disrupt large industries
Result: No sign of any bubble. The stock market continued straight up.
Published 7/8/2020 - The stock market is poised for a 40% drop, warns economist who says the current climate feels a lot like 1929
Result: No drop. The stock market has continued straight up.
Published 9/8/2020 - Be prepared for 1,000-point Dow selloff before the presidential election: strategist
Result: This prediction came true, but it was rather unimpressive because it's not far off from what we would expect from pure luck. 10 year ago a 1,000 point "selloff" would have been more than 10%. Unfortunately, 1,000 points today is only 3.6%. On average, the stock market corrects 5% about every 4 months on average. We don't have any statistics for the frequency of 3.6% drops but it's certainly less than every 4 months.
There we have it! 6 years of headlines that grabbed your attention, but were almost always a bad idea to react to.
Historically the stock market corrects 10% about every 11 months on average, so if and when someone predicts a "correction" are they Nostradamus or are they nothing more than a Texas Sharpshooter? And even if you predicted the crash of 1987 by getting out of the market 10 months ahead of time and then miraculously getting back in at the bottom, you merely broke even. Actually you had to pay capital gains taxes prematurely.
We are constantly being bombarded with doom and gloom headlines yet nobody can consistently predict the direction of the markets with any consistency. Your best course of action is to remain constantly diversified into your predetermined bond / stock allocation ratio without being influenced by the constant barge of flavor-of-the-day news.
If you are insistent on trying to time the next stock crash then you might focus on slow moving basic metrics such as the S&P 500 index P / E ratio and the Schiller P / E ratio. John Bogle says that when the S&P 500 index P/E ratio reaches 20 this is a good warning sign that the markets might be getting lofty. Then if you choose to take action, favor bonds and consumer staples stocks a little more that you would otherwise. Resist the urge to make large bets that are completely out of line with your ideal bond / stock allocation ratio, such as getting completely out of the market and into cash.
Disclaimer and Waiver - Nothing on this consumer advocate website is intended as investment, tax, accounting or legal advice, as an offer or solicitation of an offer to buy, hold or sell, or as an endorsement, of any company, security, fund, product or other offering. This website, its owners, affiliates, agents and / or contributors are not financial or investment advisors or broker / dealers and assume no liability whatsoever by your reliance on the information contained herein. The information should not be relied upon for purposes of transacting securities, assets, financial products or other investments. Your use of the information contained herein is at your own risk. The content is provided 'as is' and without warranties, either expressed or implied. This site does not promise or guarantee any income or particular result from your use of the information contained herein. It is your responsibility to evaluate any information, opinion, advice or other content contained. Always hire and consult with a professional regarding the evaluation of any specific information, opinion, or other content.