Just how risky are the markets?
Investor ignorance plays right into the hands of the sharks
 The sharks who are trying to sell you expensive products and services such as annuities, life insurance, gold, market timing services, limited partnerships, non-traded REIT's, alarmist literature and other crap are world famous for ignoring diversification into bonds. They know full well that most of the general public is ignorant about how bonds smooth out stock market volatility. When stocks fall, money runs to the safety of bonds, and vice versa. Money has to go somewhere! But don't expect Mr. Salesman (who calls himself an "adviser") to educate you about modern portfolio theory.
And if you're ignorant about the 4% rule, don't expect Mr. Salesman to explain to you that with a 30 year time horizon you should only be drawing no more than 4% of your savings per year.
With a 20 year time horizon (at perhaps age 80) you can safely take out between 5.1 and 5.5% according to research.
Instead Mr. Salesman carries on about how senior citizens had to go back to work at McDonald's after the 2008 - 2009 market crash, never mentioning why that happened. Was it the stock market's fault? No! As we shall see below, it was a failure to diversify into bonds and / or a failure to observe the 4% rule in retirement.
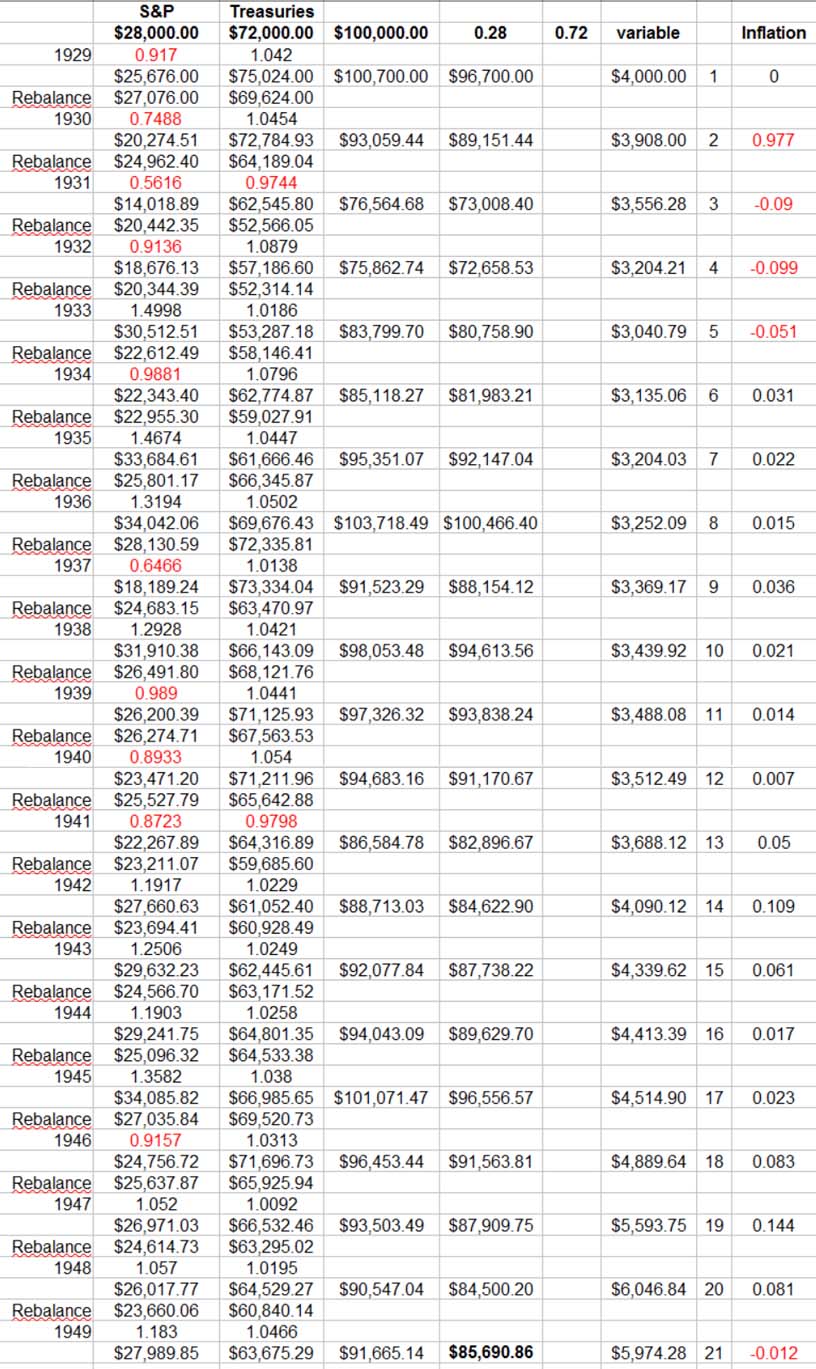
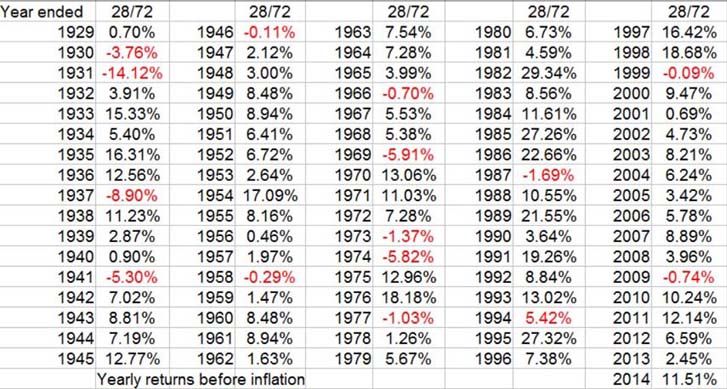
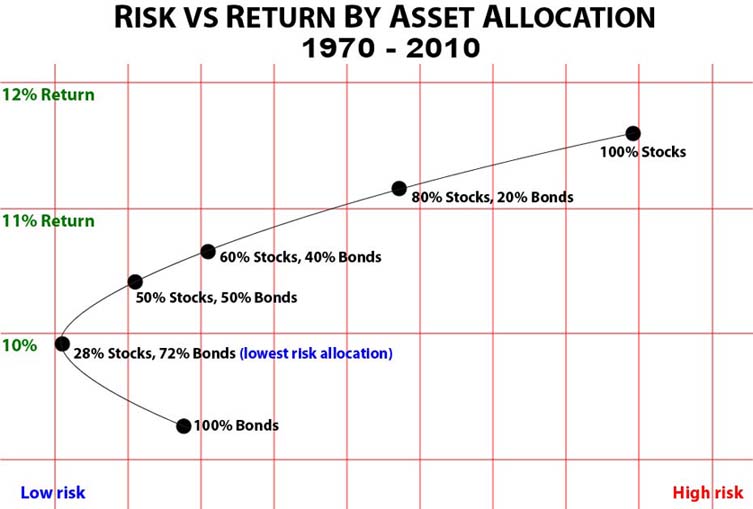
So let's back-test a portfolio of 28% S&P 500 index and 72% 10-Year Treasuries. Why 28/72? Because according to Ibbotson this was the lowest risk allocation ratio from 1970 to 2010. This is no secret to insurance companies because they invest anywhere from 70% to 90% in bonds.
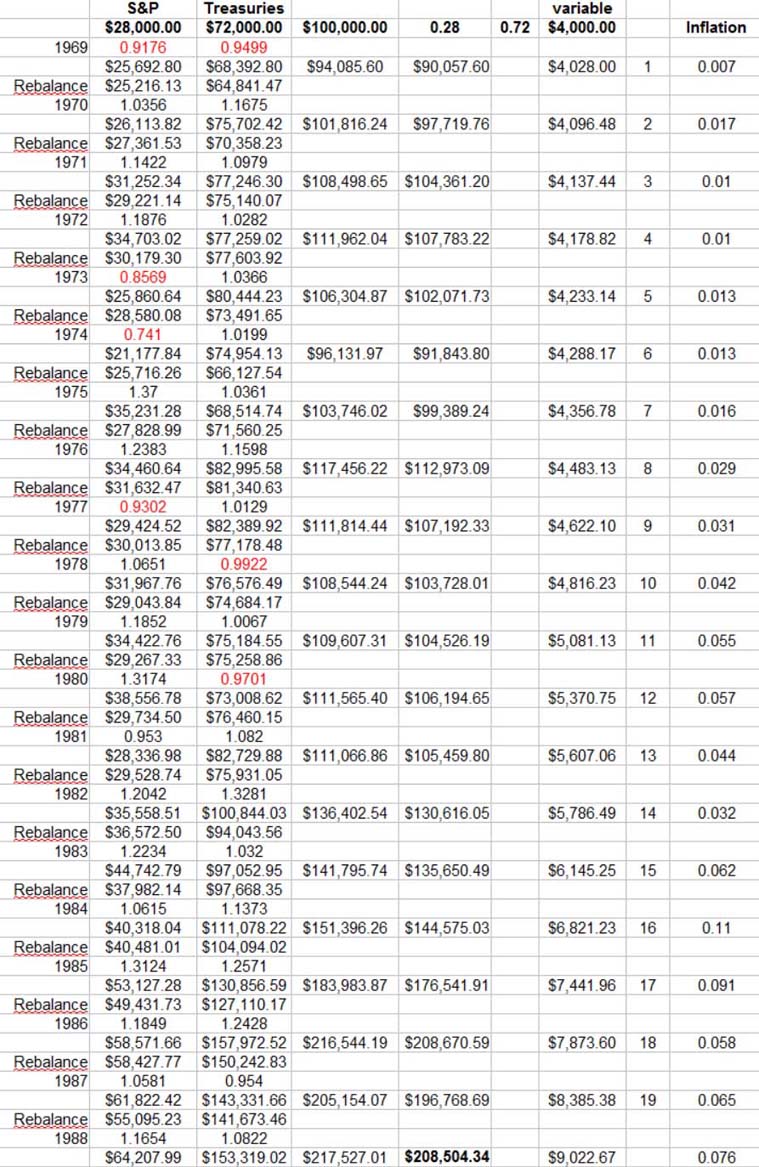
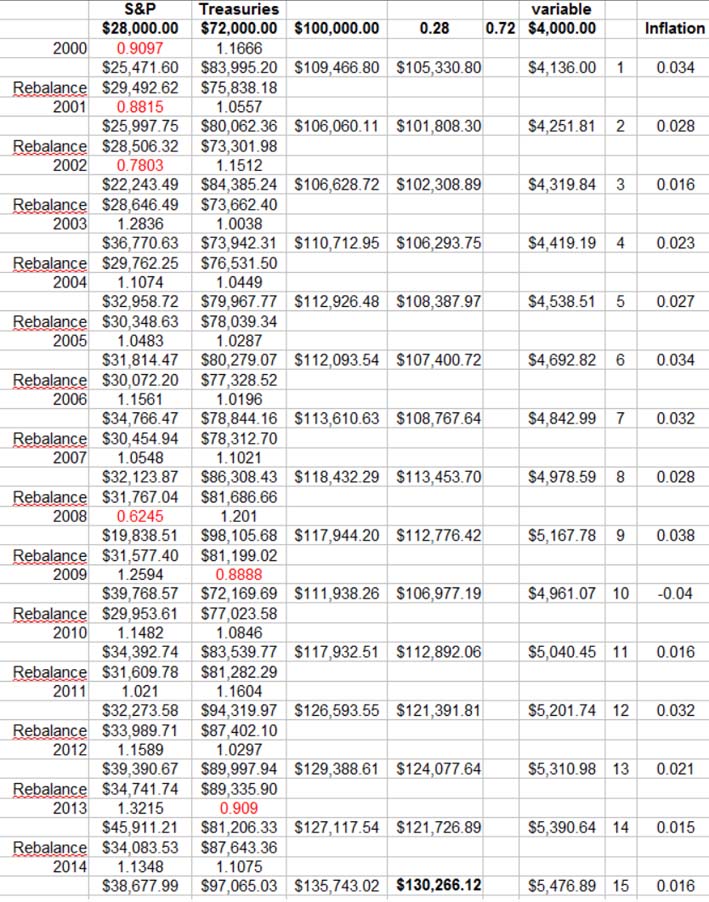
Below we have selected the 3 worst time periods to enter retirement and start drawing from your savings: 1929 (start of great depression), 1969 (low returns and high inflation) and 2000 (recession).
It should be noted that the stock market of today is not the stock market of 1929. A stock market crash of 90% would seem highly unlikely. Click here to learn about the causes of the 1929 crash and you'll agree.