
DIVERSIFICATION
The way to cushion against stock market volatility is by owning not just stocks but bonds too. Don't expect to be educated about the basic principal of bond / stock diversification by product pushing salesman who sell annuities, non-traded REITS, gold, market timing services, etc.
By 2009 many retiree investors who were both over-allocated into stocks and drawing money from their savings saw their portfolios drop dangerously low and had to go back to work. But it wasn't the stock market's fault. It was their fault for putting too many eggs in the stock market "basket"!
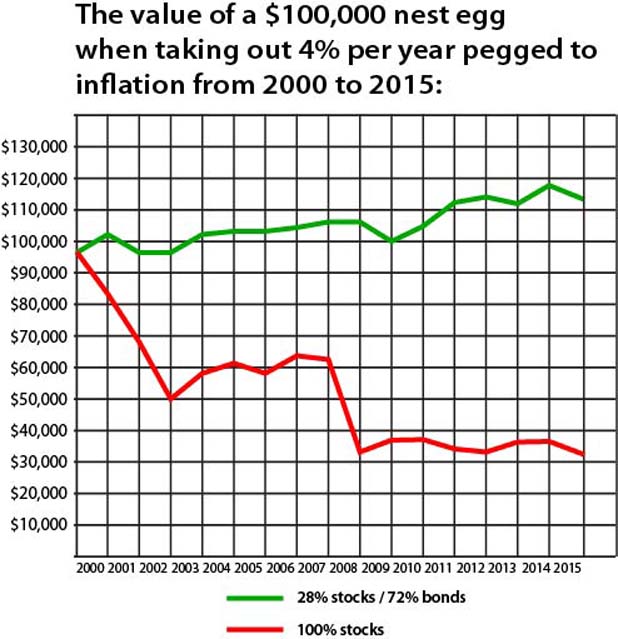
Above rate of withdrawal for each year: Jan 2000: $4,000, 2001: $4,136, 2002: $4,251.81, 2003: $4,319.84, 2004: $4,419.19, 2005: $4,538.51, 2006: $4,692.82, 2007: $4,842.99, 2008: $4,978.59, 2009: $5,167.78, 2010: $5,147.11, 2011: $5,229.46, 2012: $5,396.81, 2013: $5,510.14, 2014: $5,592.79, 2015: $5,682.28, 2016: $5,687.96
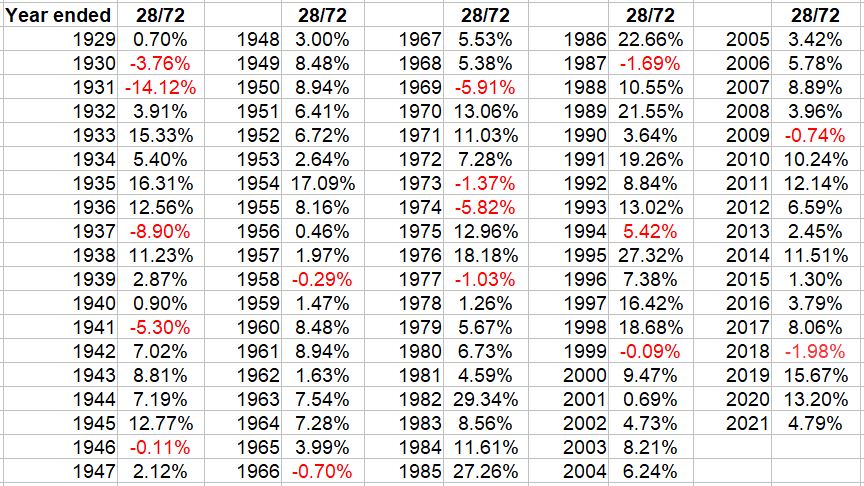
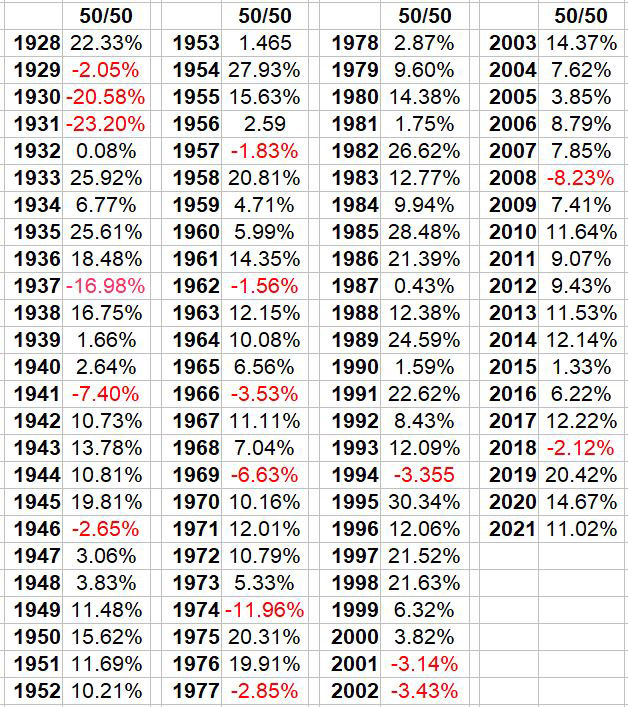
Historical performance of a 28% S&P 500 index / 72% 10-Year Treasury bond portfolio
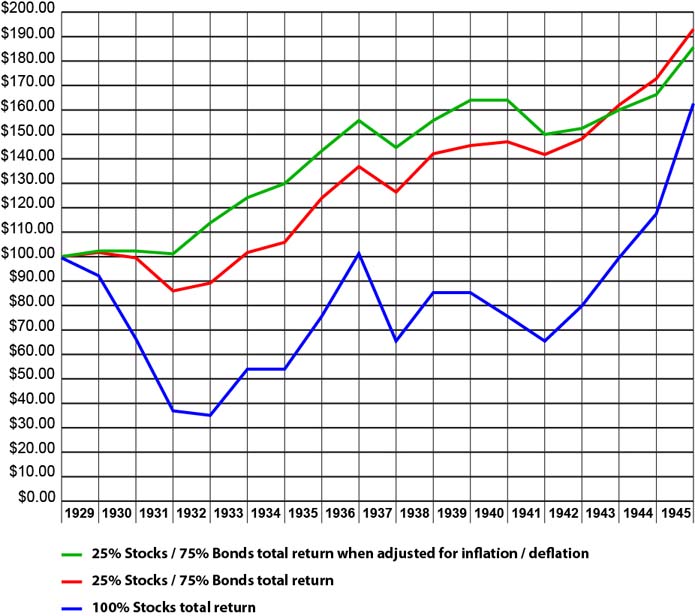
How did a 75 / 25 portfolio hold up during the great depression?
This question is also covered in the annuity discussion.
A stock market crash of 90% is highly unrealistic today. The stock market today is not what it used to be back then. But just for fun let's take a look at how diversification into bonds protected you back then. From 1929 to 1946 your portfolio was never in danger of running down to zero. Unlike the charts above in which we took out about 5.5% per year, in this example the money is allowed to compound and dividends are reinvested. The lowest the 75/25 portfolio ever dropped to was $85,524 at the end of 1931, however when adjusting for deflation of the 1930's you were actually even at that low point in time! Not bad considering that you were 3 years into the great depression!
Now let's look at what would happen if we were in retirement, drawing out 4% per year from our savings, and with that 4% pegged to the annual rate of inflation / deflation. This chart below also accounts for annual rebalancing on Jan 1 of eavery year. Even while living off of the nest egg, you did not out of money. Keep in mind that portfolio values below are not adjusted for inflation / deflation. There was double digit deflation in the early 1930's.
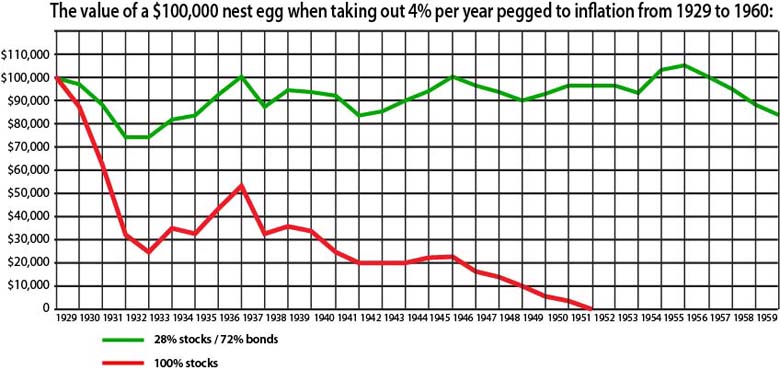
Above rate of withdrawal for each year: $4,000, $3,893.60, $3,545.51, $3,180.32, $3,018.45, $3,124.39, $3,204.38, $3,237.70, $3,358.47, $3,290.96, $3,248.18, $3,271.89, $3,649.37, $3,868.34, $3,931.78, $4,021.03, $4,360.00, $4,998.74, $5,385.64, $5,334.48, $5,403.83, $5,830.73, $5,941.51, $5,989.05, $6,030.97, $6,006.85, $6,096.95, $6,298.15, $6,474.50, $6,519.82
Historical performance of a 50% S&P 500 index / 50% 10-Year Treasury bond portfolio
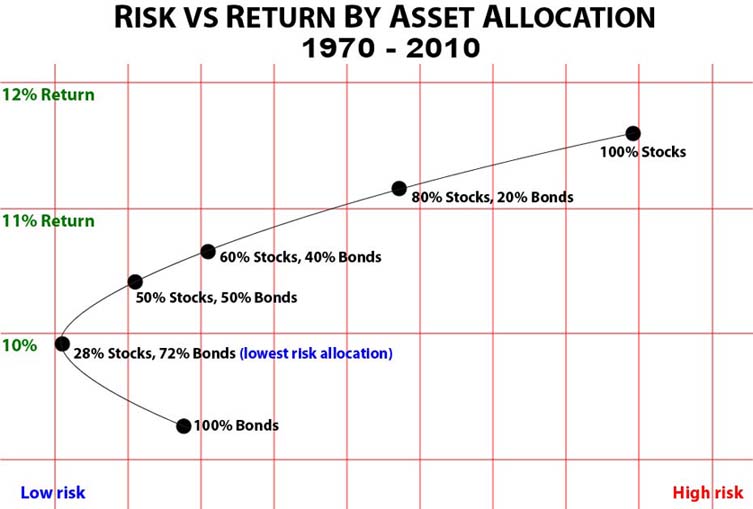
What has been the lowest risk asset allocation?
According to a study, from 1970 until 2010 a portfolio of 28% stocks and 72% bonds was the lowest risk allocation ratio. Notice in the chart below that by investing in 100% bonds alone you were taking on more risk than by adding a position of 28% in stocks. While past performance does not guarantee future results, this study does provide some general guidelines for those who seek low risk. In fact Bill Gross, the biggest fixed income manager in the world, has warned that the three-decade bond bull market is likely over. Accordingly at this point in time, advisers seem to be recommending a little more exposure to stocks than 28%. They are certainly not recommending getting all out out of bonds either because when stocks fall, money runs to the safety of bonds. If stocks crash you will be happy that you put some of your money in bonds. Take the opportunity to rebalance. DISCLAIMER: This is not to say that a 28/72 portfolio will turn out to be the lowest risk allocation moving forward or that taking the lowest risk is the best strategy for you right now.
RUN AWAY FROM ANY "ADVISER" WHO IGNORES DIVERSIFICATION in order to sell you a high commission product like an annuity! Ignoring diversification is a deceptive, dishonest technique by which commission-based and even fee-based" advisers" try to sell high commission products like annuities, life settlement investments, indexed universal life insurance, and other commission-based financial products that are touted as "not being tied to stock market ups and downs" or what they call not tied to "the Wall Street Casino". They'll say "Look what happened to the stock market from 2000 to 2009", when in reality, as illustrated at the top of this page, history has demonstrated that bonds and stocks are generally safe.
The flip side: Taking on too little risk may
result in you missing out on huge gains
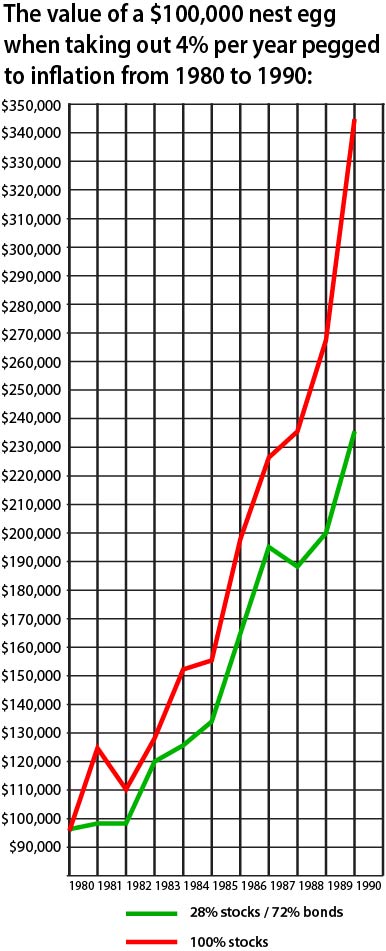
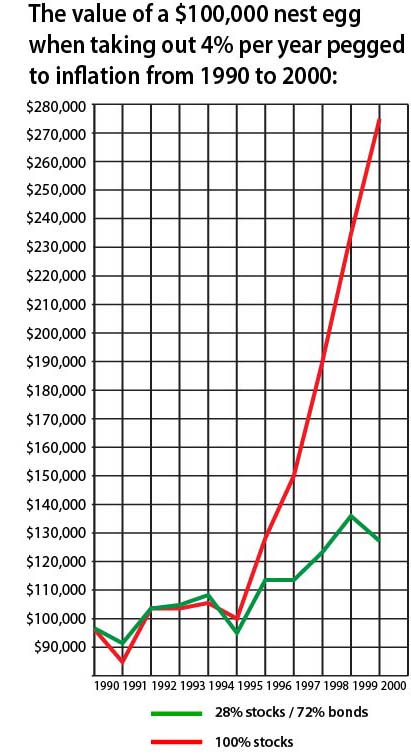
Just as a conservative bond heavy portfolio will protect you from stock market crashes, it can also result in you missing out on huge gains if the stock market decides to make big advances such as it did during the 80's and 90's. During the 80's decade alone, your money grew 46% more if you were allocated 100% in stocks versus just 28% in stocks / 72% bonds. During the 90's decade you money grew about 118% more. Or during this entire 20 year stretch, a $100,000 nest egg grew to $507,809 with 28% in stocks and 72% in bonds, but with 100% in stocks grew to $1,587,429 or a 212% greater return. Each of the models below uses calendar rebalancing on January 1st of every year.
 |
 |
Finance professor Benjiman Graham said to stay within the range of 25/75 to 75/25: "We have suggested as a fundamental guiding rule that the investor should never have less than 25% or more than 75% of his funds in common stocks, with a consequent inverse range of between 75% and 25% in bonds."
Related links:
Stock and bond returns from 1980 - 2013
New York University stock and bond returns since 1928
Compounding Return on Investment Calculator
Simple Return on Investment Calculator
Disclaimer and Waiver - Nothing on this consumer advocate website is intended as investment, tax, accounting or legal advice, as an offer or solicitation of an offer to buy, hold or sell, or as an endorsement, of any company, security, fund, product or other offering. This website, its owners, affiliates, agents and / or contributors are not financial or investment advisors or broker / dealers and assume no liability whatsoever by your reliance on the information contained herein. The information should not be relied upon for purposes of transacting securities, assets, financial products or other investments. Your use of the information contained herein is at your own risk. The content is provided 'as is' and without warranties, either expressed or implied. This site does not promise or guarantee any income or particular result from your use of the information contained herein. It is your responsibility to evaluate any information, opinion, advice or other content contained. Always hire and consult with a professional regarding the evaluation of any specific information, opinion, or other content.